8. Analyzing and Modifying Chart Data
Make a detailed analysis of chart data by:
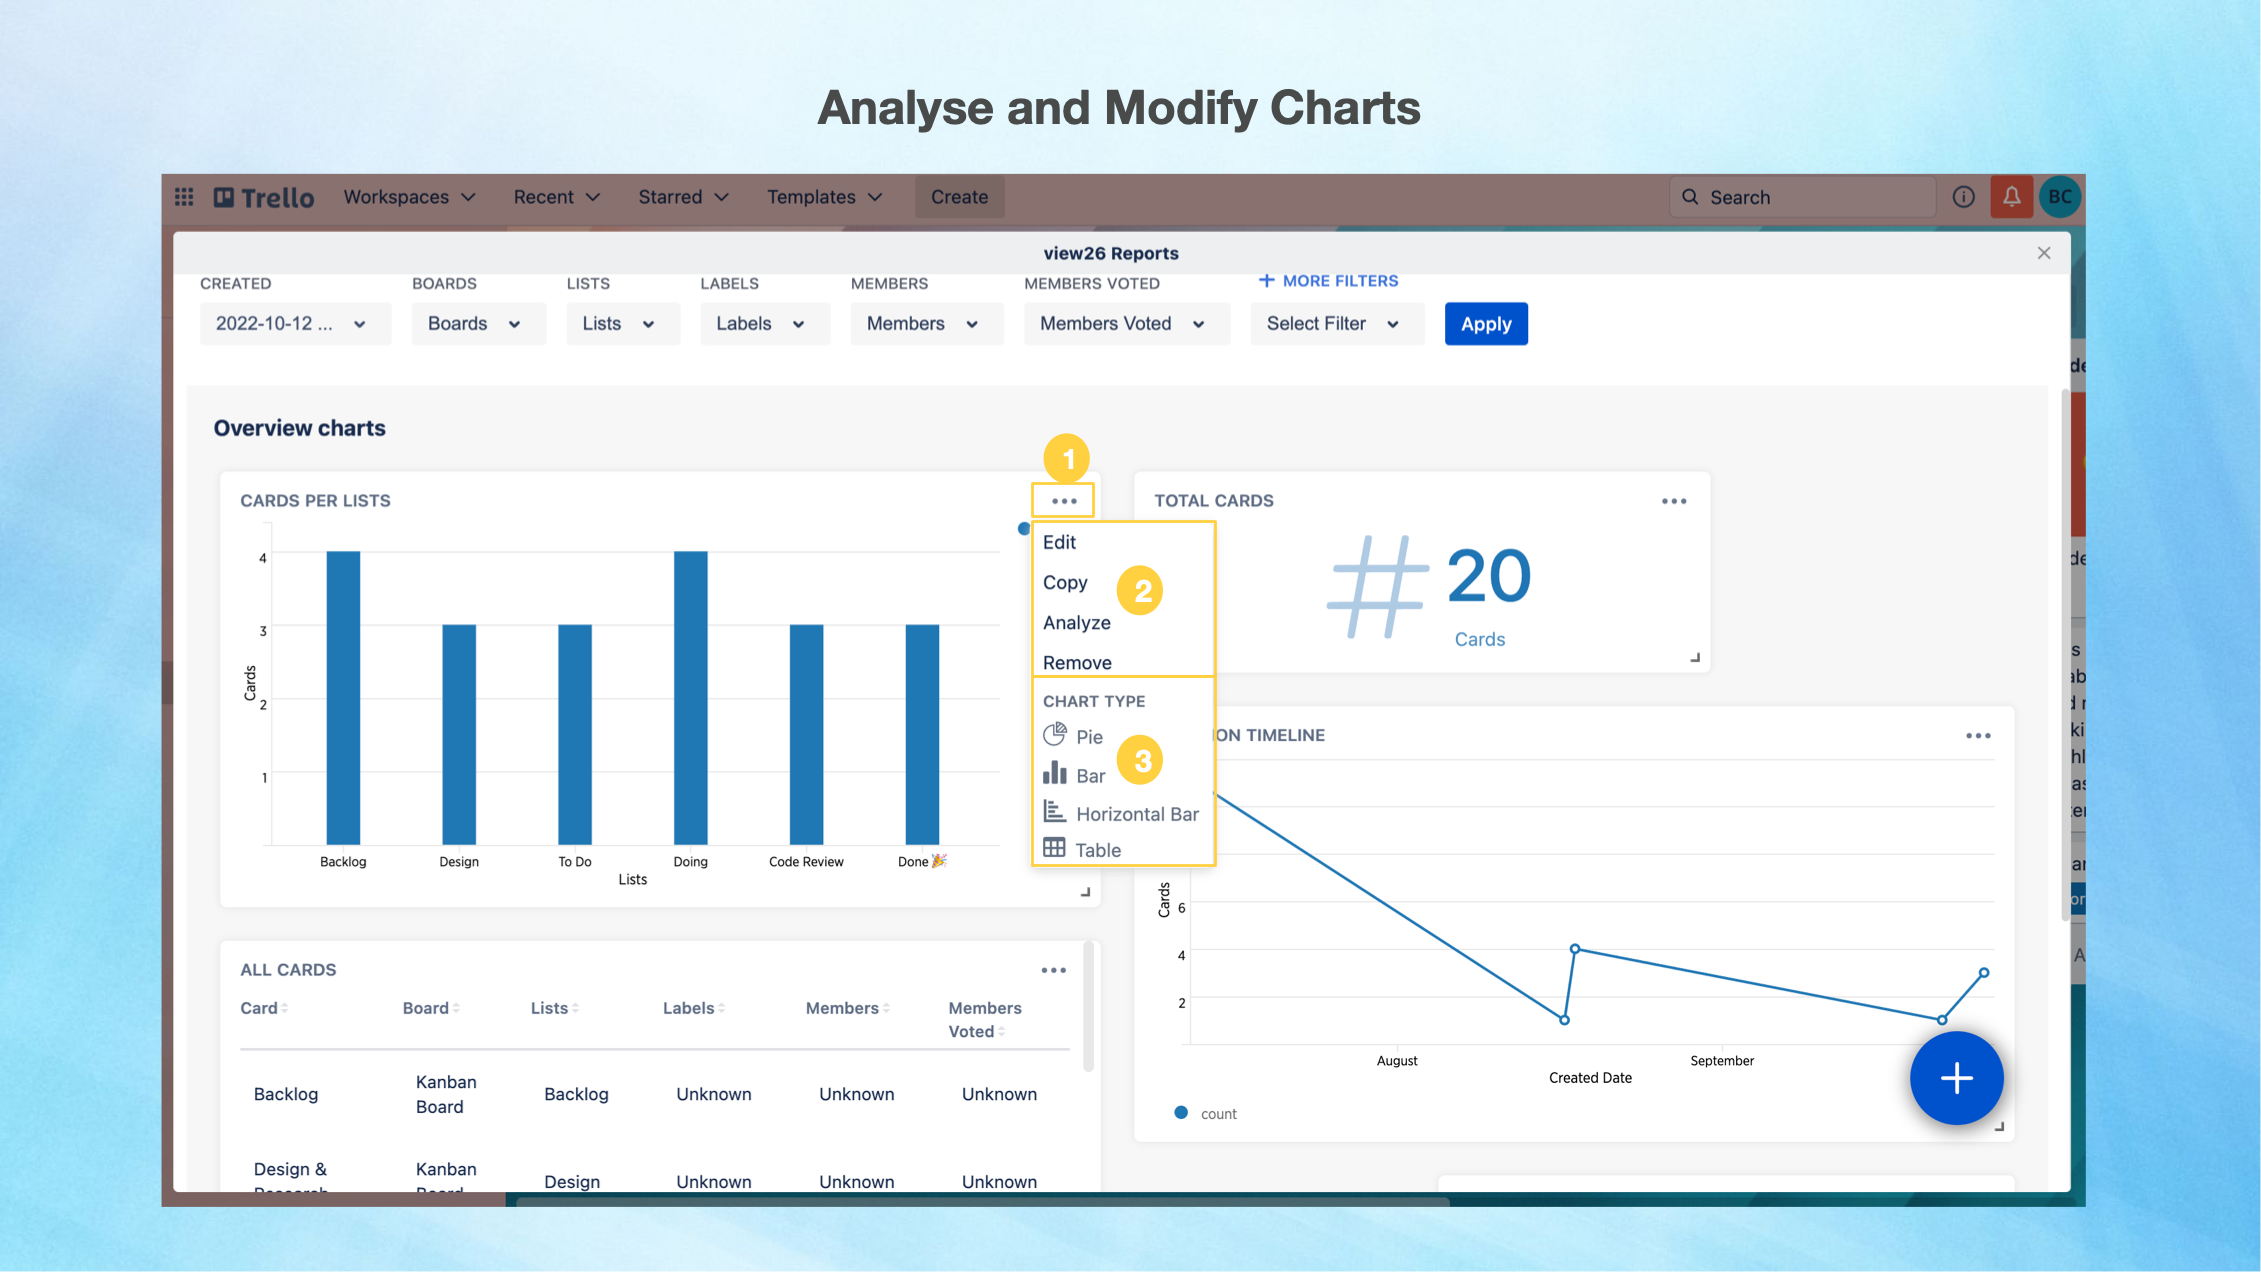
1. Select the (. . .) Options Menu on the top left of your Chart Widget.
2. you can
Click Edit to modify the Widget/Chart details (Name , Description, Type, Filters etc)
Click Copy to make a copy of the Widget
Click the Analyse option to open up a detailed view of the chart.
You can remove a chart by clicking Remove
3. It is also possible to change your Chart type anytime. You have to options to display as Pie , Bar or Horizontal Chart . Table data display can be displayed too
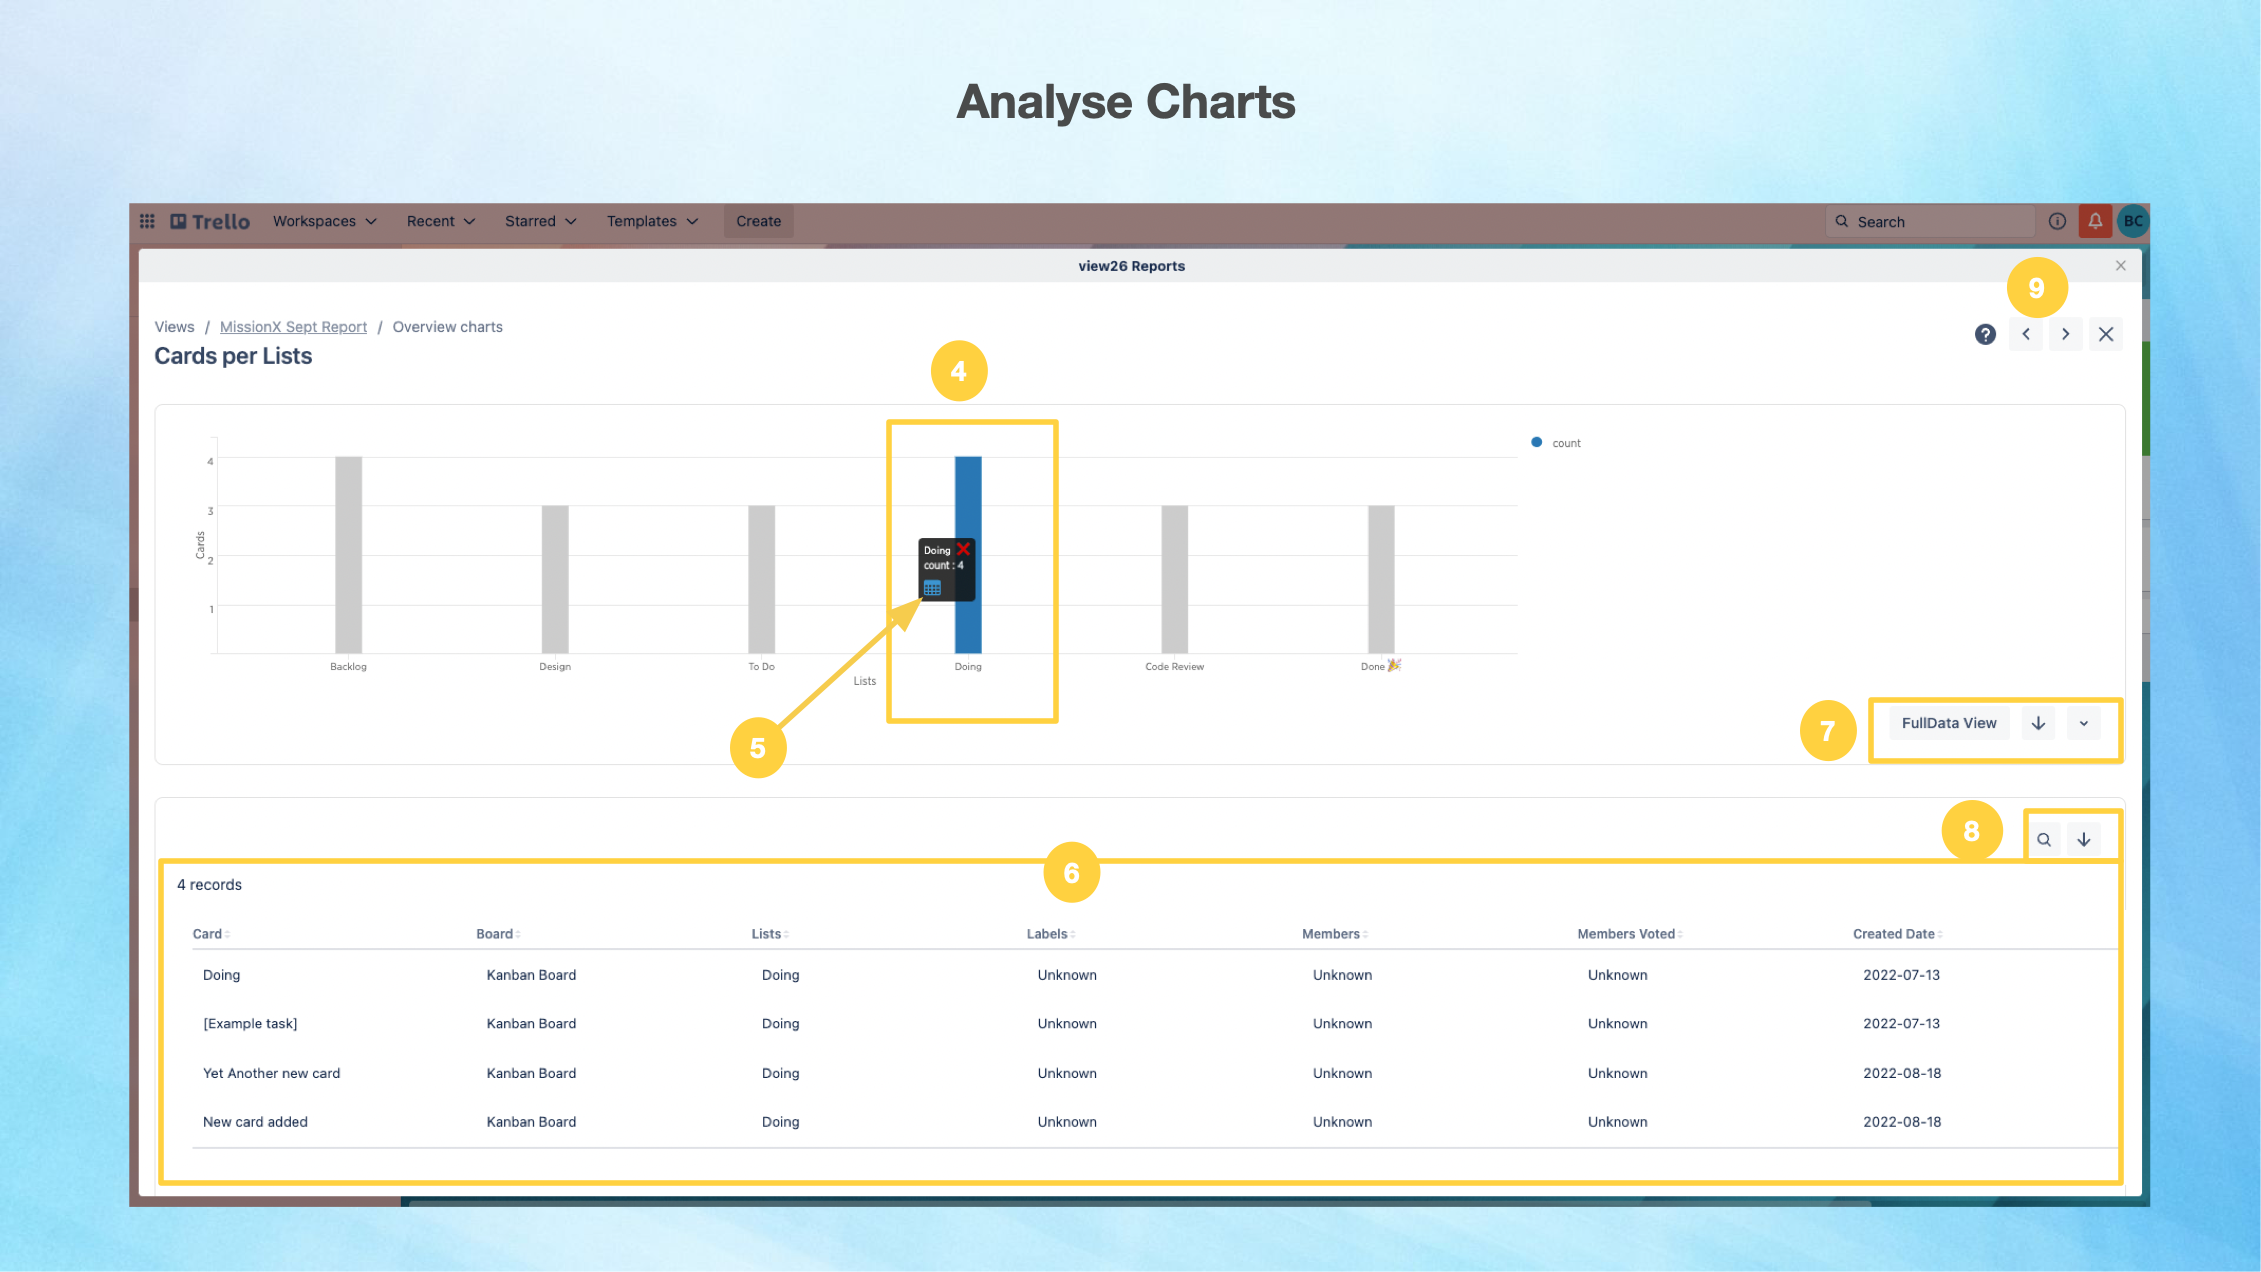
To Analyse the chart data:
Once you have clicked the Analyse option under (. . .) Options Menu ,
4. Click / hover over the Data Point of interest to show further details on your specified data
5. Click on the Table View icon to drill down to details of the selected Data Point in table format
6. The Table is displayed below the chart
7. Click on Full Data View to view the details of the entire Chart Data in table format below the chart. You also have the option to Download the Page or Change your View to Bar, Table, Horizontal Bar or Pie Charts
8. You can Search for a Keyword or Download the Table Data
9. You can easily navigate to the other widgets by clicking the ⬅️ ➡️ arrows